Note
Go to the end to download the full example code
Cross Validation with DFO Regressor
Using CV to find the right number of features to keep.
import numpy as np
import matplotlib.pyplot as plt

from sklearn.datasets import make_regression
from sklearn.model_selection import train_test_split, GridSearchCV

from discretefirstorder import DFORegressor
Creating a synthetic dataset with some uninformative features
We create a synthetic dataset with only 10 informative features. We keep the true coefficients for comparison with the estimates.
Grid search with k-fold cross validation to find the optimal cardinality parameter
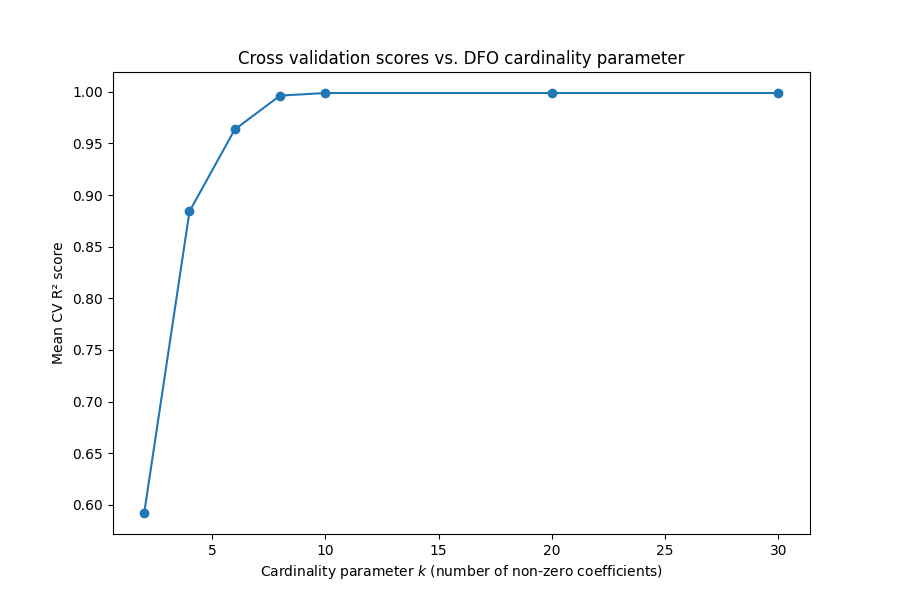
A priori, we don’t know the optimal size of our feature subset. We can use sweep through a list of possible values and perform cross validation to select the cardinality parameter that seems to provide the best fit. As expected, the best score is achieved with a feature cardinality of 10, in this case.
parameters = {"k": [2, 4, 6, 8, 10, 20, 30]}
dfo = DFORegressor()
clf = GridSearchCV(dfo, parameters)
clf.fit(X_train, y_train)

print(clf.best_estimator_)
print(clf.best_score_)
DFORegressor(k=10)
0.9988501325091541
Visualizing the mean CV scores for each value of the hyperparameter
param_values = clf.cv_results_["param_k"].data.astype(np.int64)
mean_test_scores = clf.cv_results_["mean_test_score"]

fig, ax = plt.subplots(1, 1, figsize=(9, 6))

ax.plot(param_values, mean_test_scores, "o-")

ax.set_xlabel("Cardinality parameter $k$ (number of non-zero coefficients)")
ax.set_ylabel("Mean CV R² score")
ax.set_title("Cross validation scores vs. DFO cardinality parameter")

plt.show()
Total running time of the script: ( 0 minutes 17.670 seconds)